Web Performance Analysis
Web Performance Analysis is a free Chrome add-on developed by godis. It provides a comprehensive display of common key performance indicators and offers insights into webpage loading waterfall and resource data analysis.
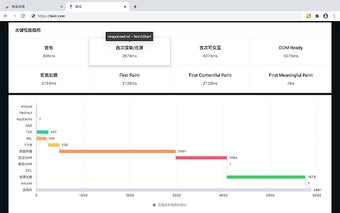
The add-on focuses on key performance indicators, excluding page unload time and redirect time. It calculates the following metrics:
1. First Byte: responseStart - domainLookupStart
2. First Render/Blank Screen: responseEnd - fetchStart
3. First Interactive: domInteractive - fetchStart
4. DOM Ready: domContentLoadedEventEnd - fetchStart
5. Page Load: loadEventStart - fetchStart
It also presents a waterfall view of various stages:
1. Unload: unloadEventEnd - unloadEventStart
2. Redirect: redirectEnd - redirectStart
3. AppCache: domainLookupStart - fetchStart
4. DNS: domainLookupEnd - domainLookupStart
5. TCP: connectEnd - connectStart
6. TTFB (Time To First Byte): responseStart - requestStart
7. Data Transfer: responseEnd - responseStart
8. DOM: domContentLoadedEventStart - responseEnd
9. DCL (DOM Content Loaded): domContentLoadedEventEnd - domContentLoadedEventStart
10. Resource Loading: loadEventStart - domContentLoadedEventEnd
11. OnLoad: loadEventEnd - loadEventStart
Additionally, the add-on provides resource analysis, including:
1. Number of resource requests, loading size, and domain distribution on the homepage.
2. Distribution of resource domain requests and their average response time.
3. Distribution of domains without response headers.
4. HTTP compression status, distribution of uncompressed resources, and cache hit rate.
5. Resource type breakdown.
6. Sampling of the top 10 most time-consuming resources and Ajax requests.
Web Performance Analysis is a powerful tool for developers and website administrators to analyze and optimize the performance of their web applications.